The research question
Do Toronto’s Airbnb market segments follow official neighbourhood boundaries? Geographic proximity is only one relationship: listings can also share hosts or similar characteristics.
The analysis models 15,809 listings from a November 2025 Toronto snapshot as a weighted network and asks whether detected communities add useful information to price prediction.
My portfolio contribution
I built the responsive React and TypeScript presentation, a reproducible Python pipeline for application data, and automated checks that keep displayed metrics synchronized with canonical analysis outputs.
This is an independently maintained portfolio edition of a York University EECS 4414 research project. The original final report retains its original submission authorship; this page does not claim sole authorship of that course report.
Build the network in layers
- Graph A: geographic proximity within 500 metres.
- Graph B: adds shared-host ownership.
- Graph C: adds listing-attribute similarity.
Louvain and Leiden community detection are compared against official neighbourhoods. Price is excluded from edge construction. A paired ridge-regression comparison then tests whether community membership adds information beyond the baseline price model.
From analysis to interactive evidence
Python experiments produce canonical tables and figures. A validation step checks those outputs, and the React presentation exposes graph layers, community algorithms, validation schemes, and sensitivity results.
The presentation is exported as static HTML, with browser-side interactivity. GitHub Actions checks the application and analytical artifacts so changes to the research do not silently leave the website out of sync.
Testing the interpretation
Communities depend on modeling choices. The project uses seven parameter configurations and random, host-grouped, and spatial-block five-fold validation to examine how stable the results are.
Separating exploratory segmentation from predictive usefulness is essential: a visually interesting map does not establish that its labels improve a predictive model.
Findings and limitations
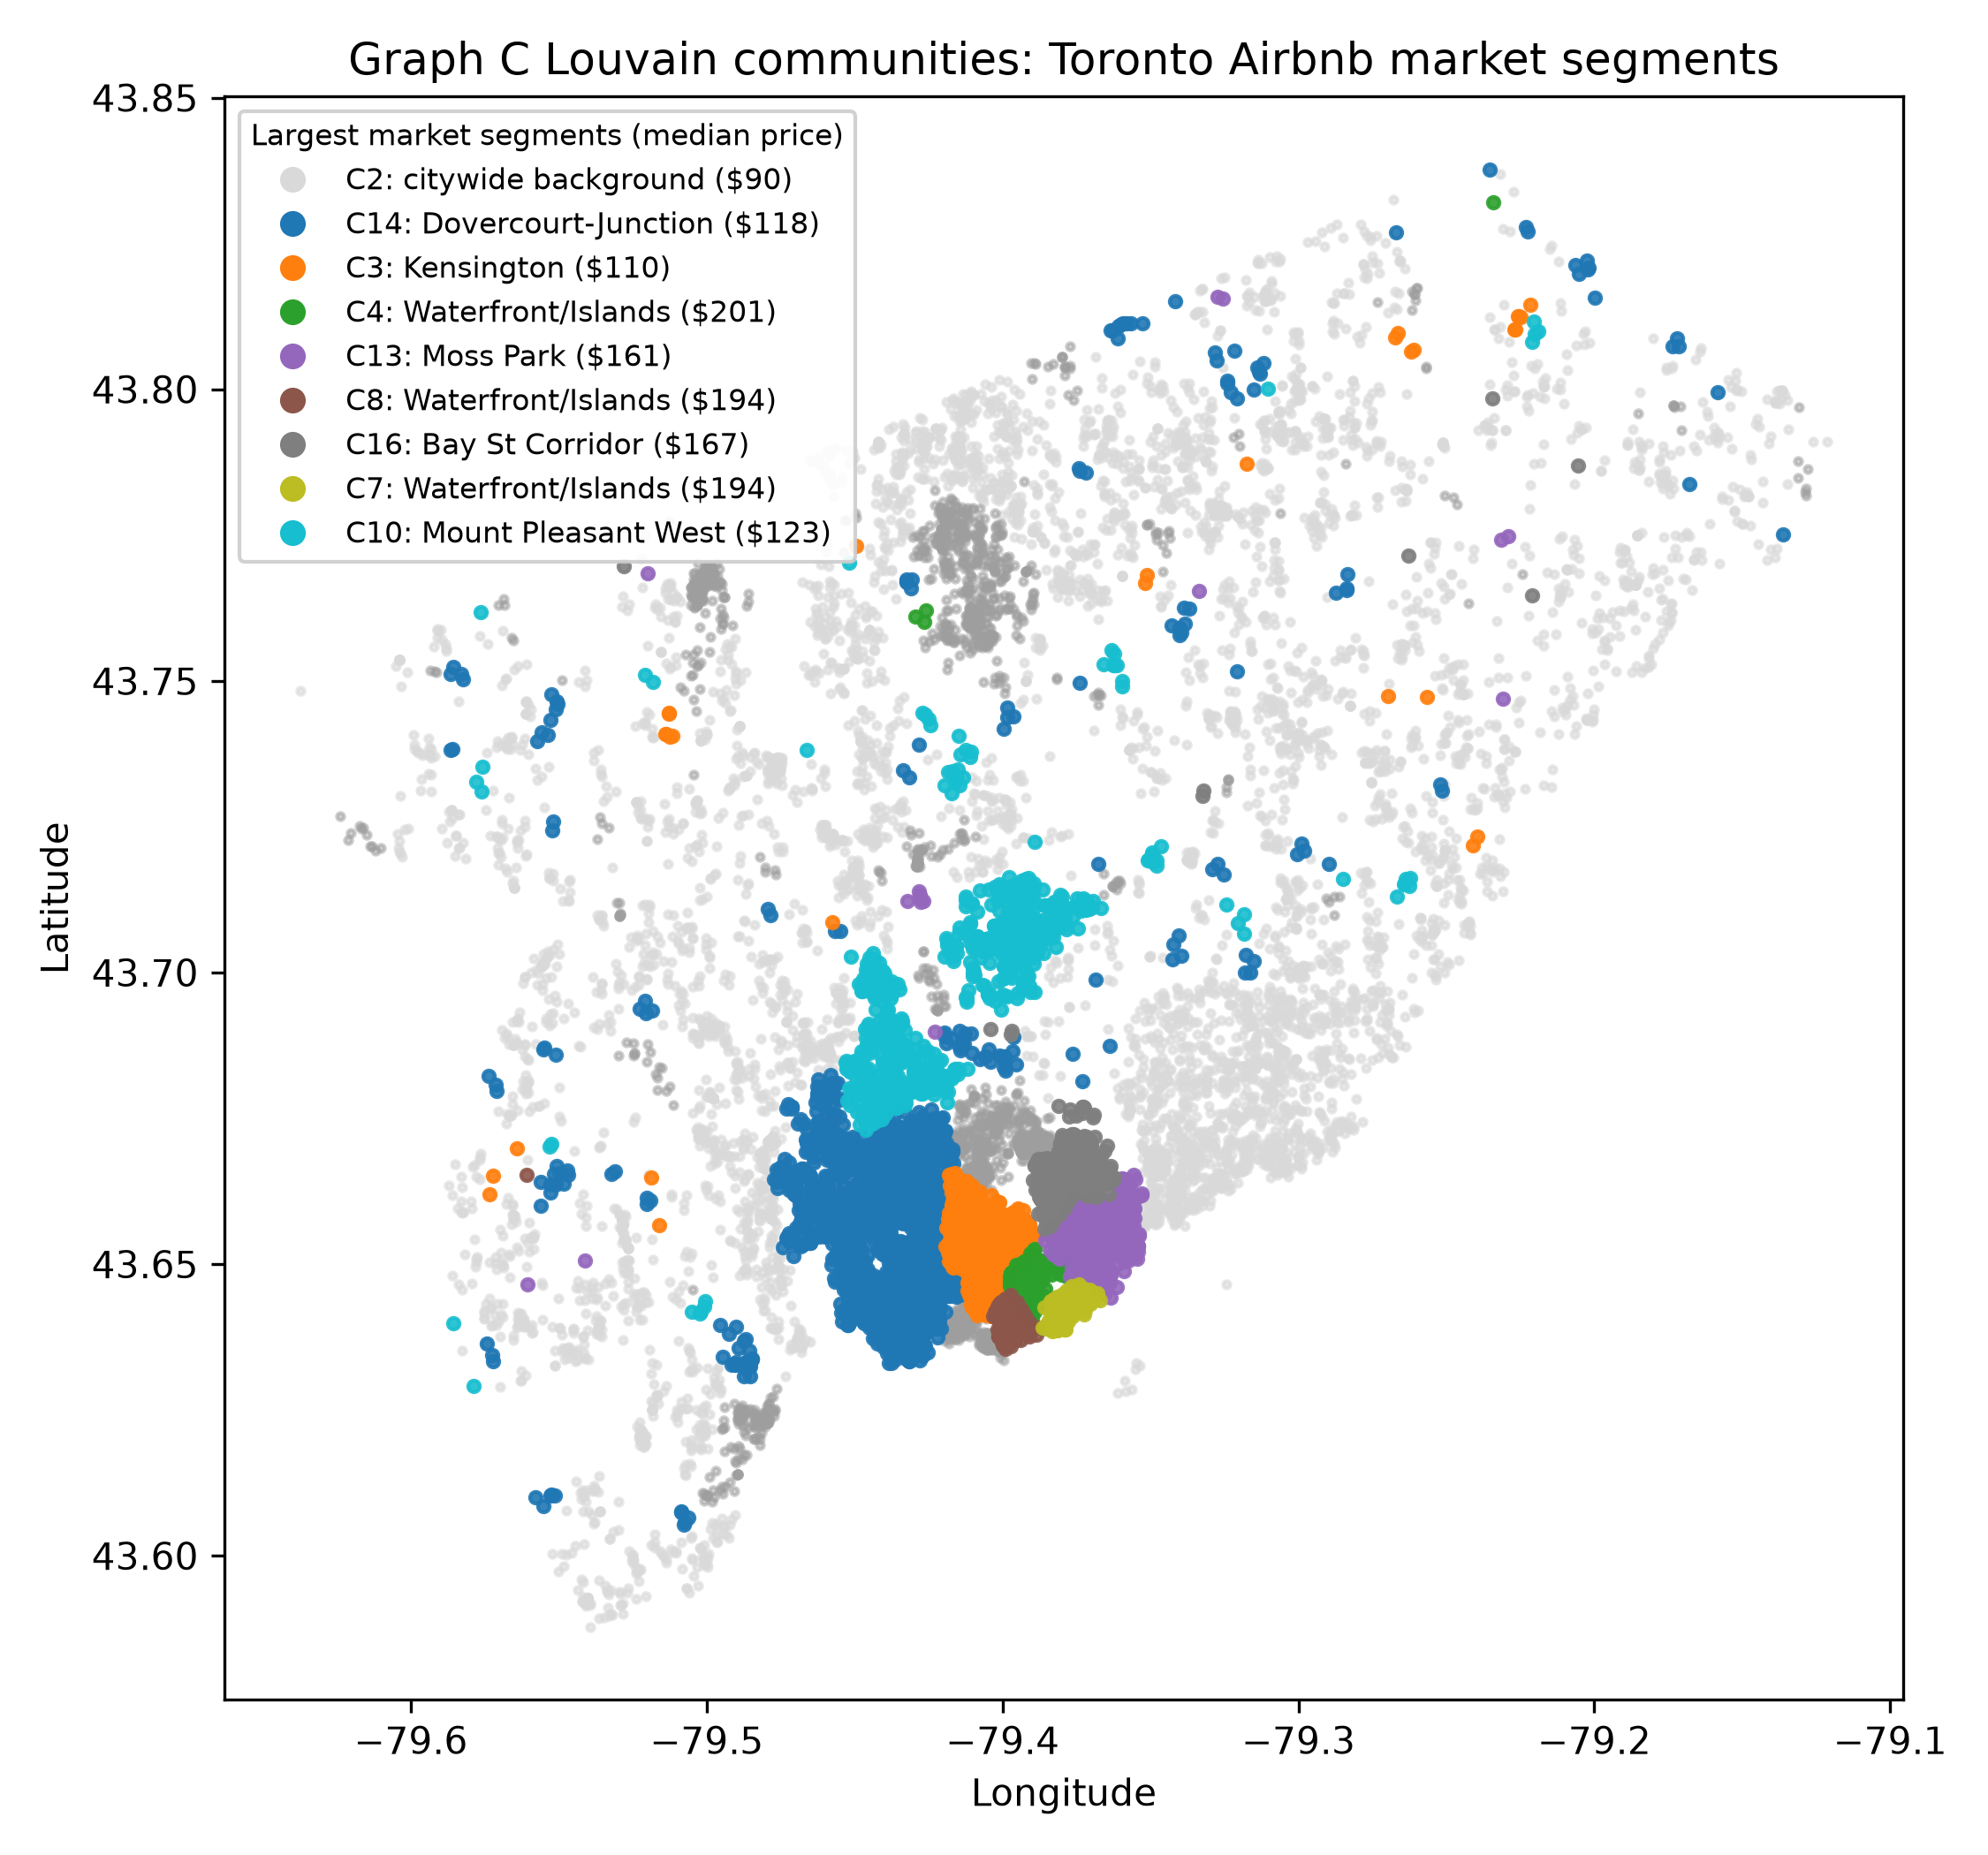
Adding ownership and similarity links connects geographic clusters into broader market segments. Spatial-only communities align most closely with official neighbourhoods, while the full graph spans those administrative boundaries.
Community membership increases mean raw R² by only 0.0016–0.0024 across validation schemes; adjusted R² declines. The study therefore does not claim a material price-prediction improvement.
Validation is transductive: communities are learned from the full price-free graph before price folds are created. It is not a deployment test on completely unseen listings. The dataset is one time snapshot, and exact community membership changes with parameters.
What the project taught me
A strong research presentation makes its uncertainty inspectable. Reproducible artifacts, explicit validation assumptions, and honest reporting make the findings more useful than a claim of improvement unsupported by the results.
Read the original course report ↗ · Read the robustness methodology ↗